Making sense of a complex world
I design and build visualisations and interactive tools that help people understand, learn and navigate complex systems.
I focus on revealing relationships in data, experience and behaviour, turning them into tools people can act on.
Explore projectsVisual systems for understanding relationships, behaviour, and progress.
Featured App
Switchplay
The Problem
In complex environments, progress is shaped by data, human judgement and the experience of other people. Yet useful knowledge is often fragmented, difficult to share, or lost in noise, while people must navigate competing priorities and stay focused on what matters most.
The Approach
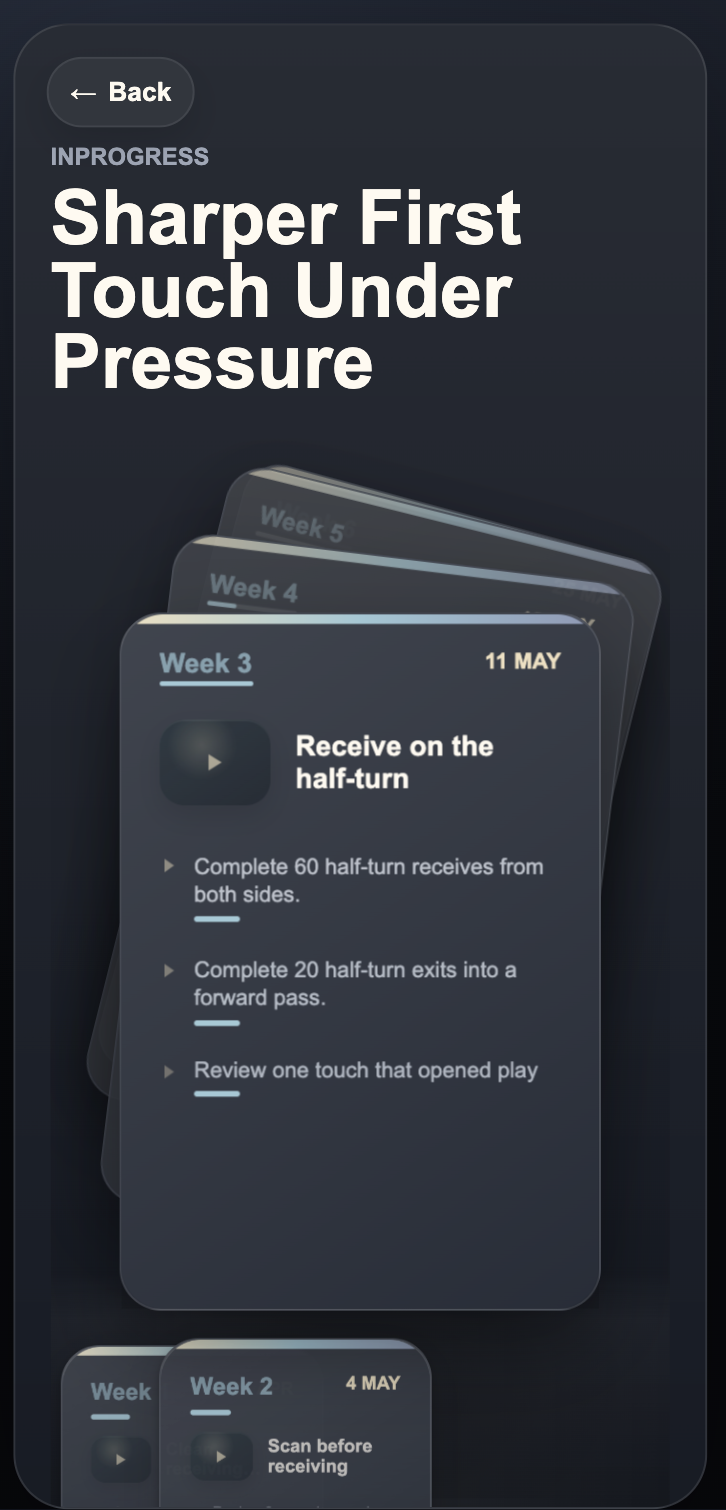
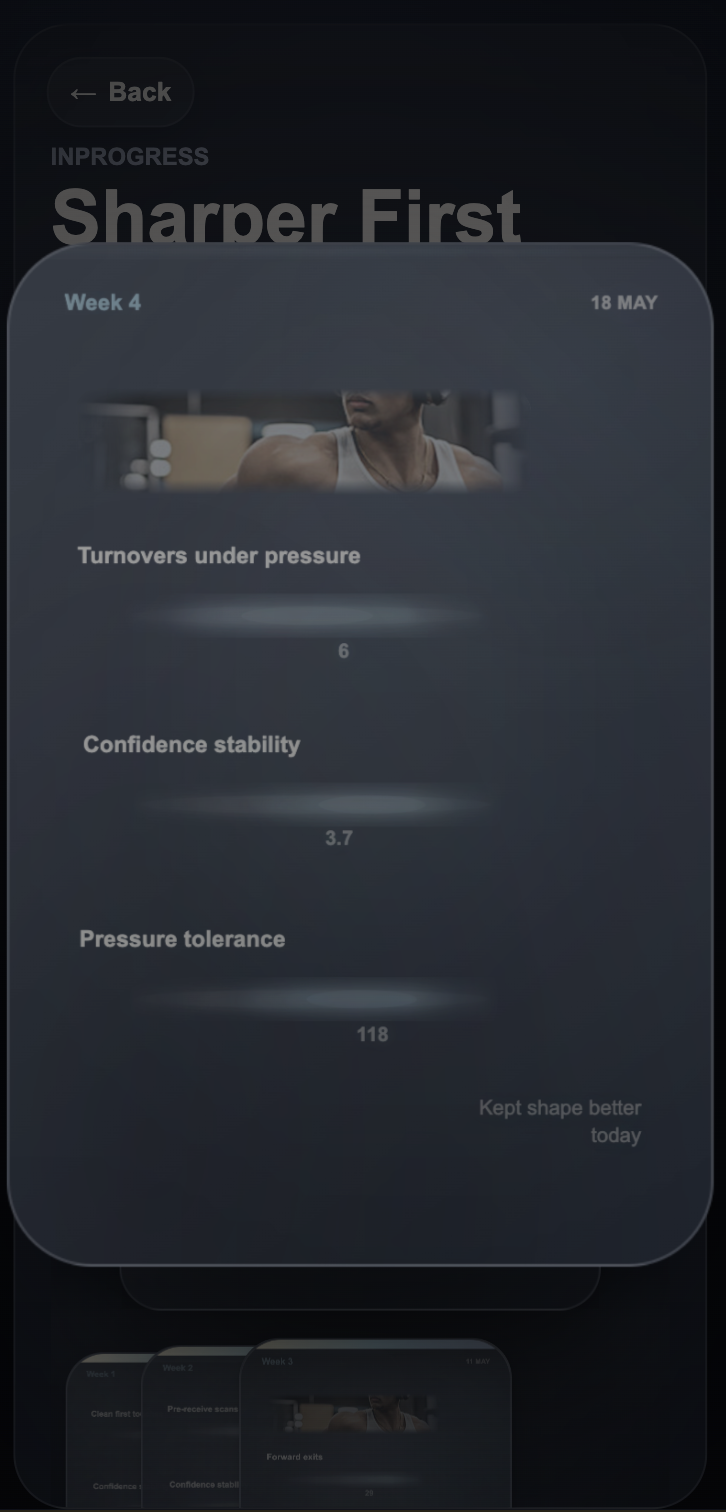
Switchplay helps people turn experience into structured, reusable paths that others can follow and adapt. Decks, layered cards and human-centred visualisations combine peer knowledge with meaningful signals—supporting progress without reducing development to scores and dashboards.
See how shared paths can help people learn from experience, focus on meaningful signals and make progress without turning data into judgement.
Featured Project
Perfect Square
Visualising multivariate data to reveal structure in complex systems.
The Problem
Complex datasets with many variables are difficult to interpret using traditional approaches. Important relationships exist across dimensions, but traditional views rarely reveal them.
The Approach
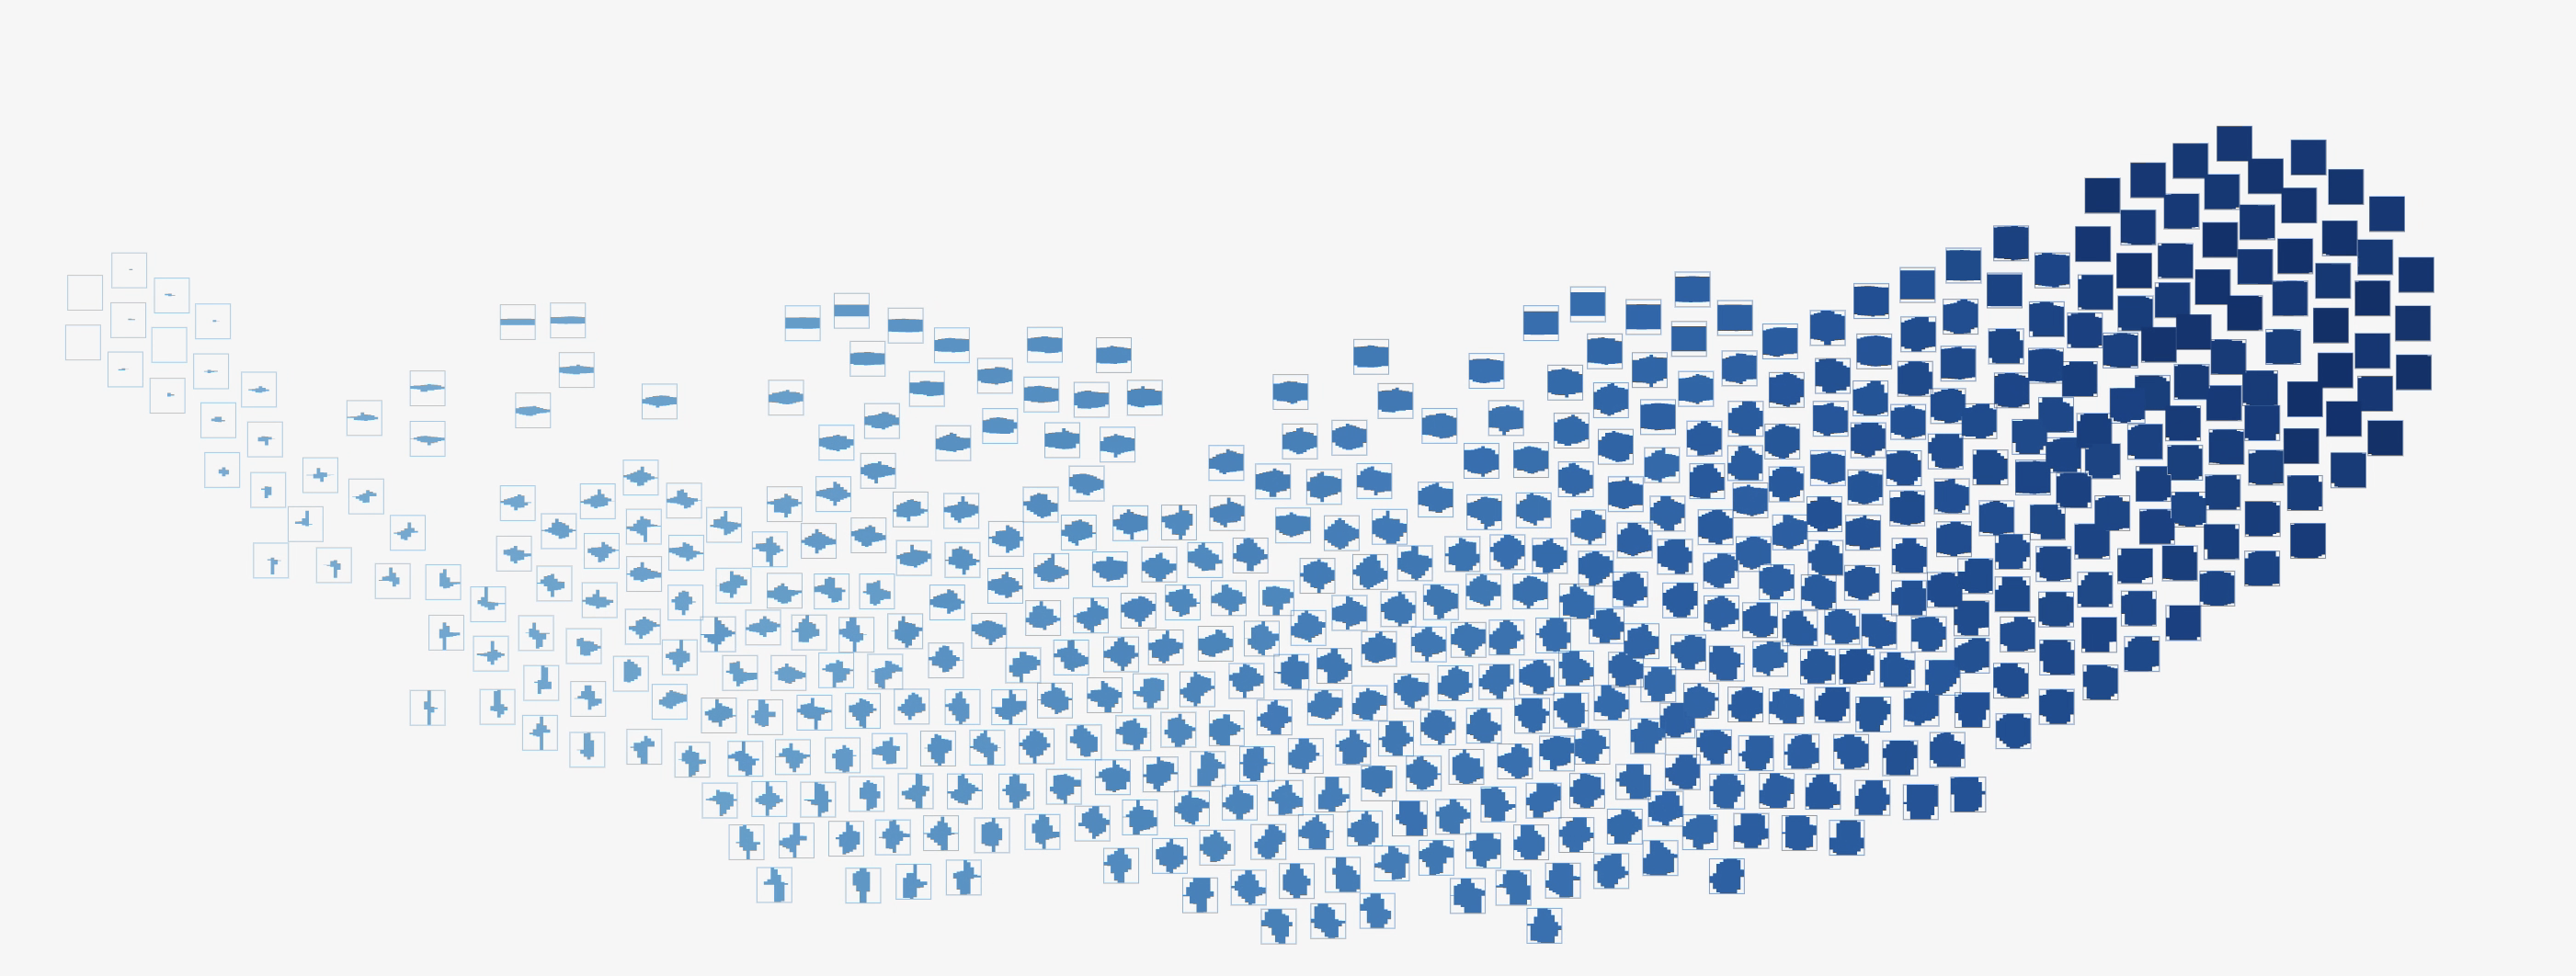
Perfect Square transforms high-dimensional data into structured visual systems using force-directed networks and semantic zooming. It reveals how patterns and grouping emerge across multiple variables.
See how multivariate relationships can be made visible through structure, grouping, and zoom.
Service Offering
Data Visualisation Audit
Find where understanding breaks down, then prioritise what to fix first.
The Problem
Data visualisations are often treated as UI components, when in reality they are specialised cognitive tools. The data may be present, but important relationships, hierarchy, and interpretation can still be difficult to see.
The Approach
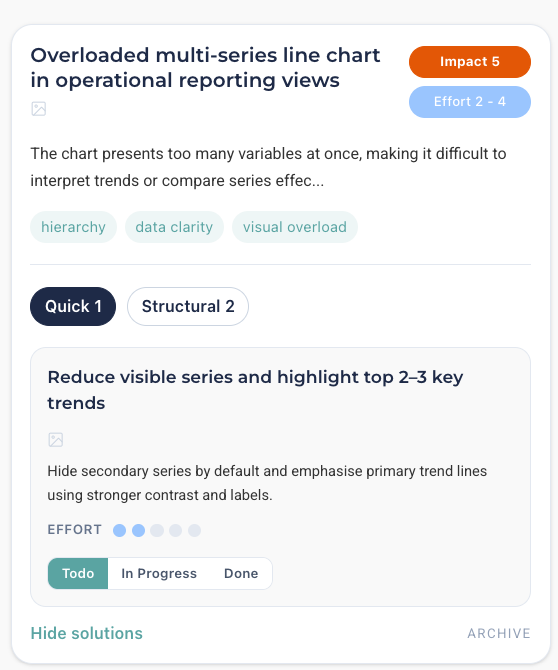
I review visualisations through a structured data visualisation lens, identifying where understanding breaks down and separating quick improvements from deeper structural issues.
Clear findings, effort and impact signals, and practical recommendations your team can use immediately.
Review sample audit →See how clarity and impact can be improved through structured, practical feedback.
Featured Projects
These are from my work in the football/education industries — I've worked across other sectors, but those projects aren't accessible for public sharing. More examples will be added soon, or get in touch to see more.

Perfect Square
Multivariate Data Comparison & Grouping Tool
The Perfect Square visualises high-dimensional data as a square that fills toward an ideal target state. Compare thousands of profiles at a glance, then zoom in for detailed KPIs. Useful for rehabilitation monitoring, recruitment profiling, and seeing vector similarity for LLM tokens.
The Race
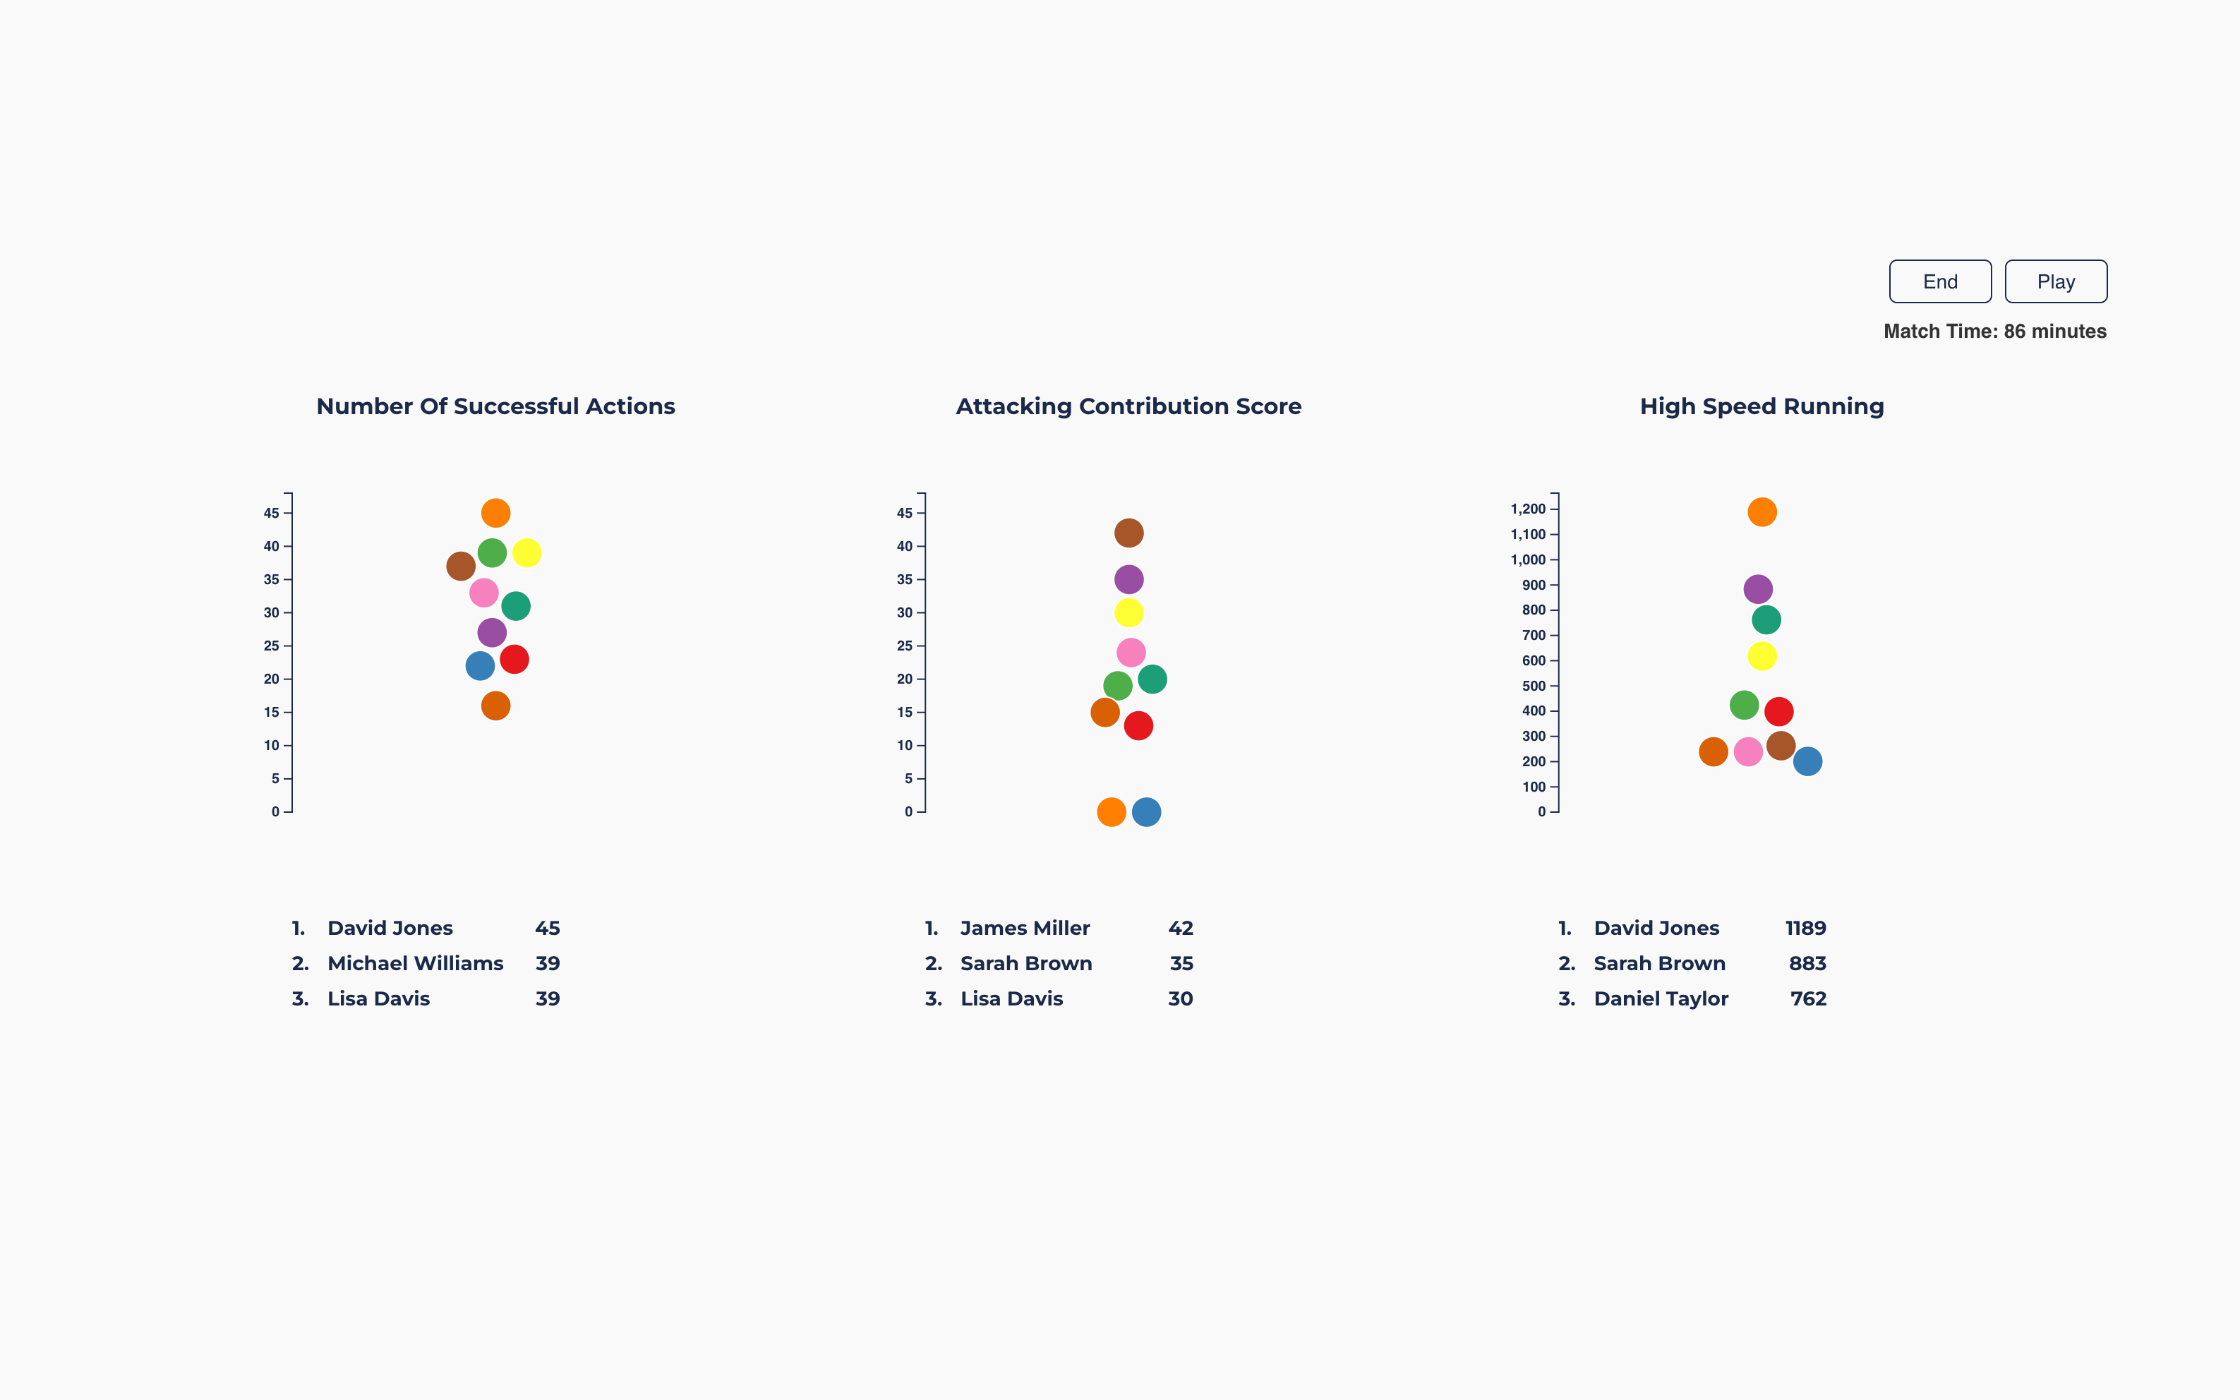
Animated KPI Race Replay
The Race turns post-match KPIs into a fast animated 'race replay'. As match time advances, cumulative performance changes are felt through overtakes and leads—making improvements and drop-offs obvious. It's a fun, emotional format for reflection and post-match discussion.
Beat Maths
Learning TEBO
Beat Maths is a lightweight learning TEBO focused on rhythm and maths.
Strategy Sim
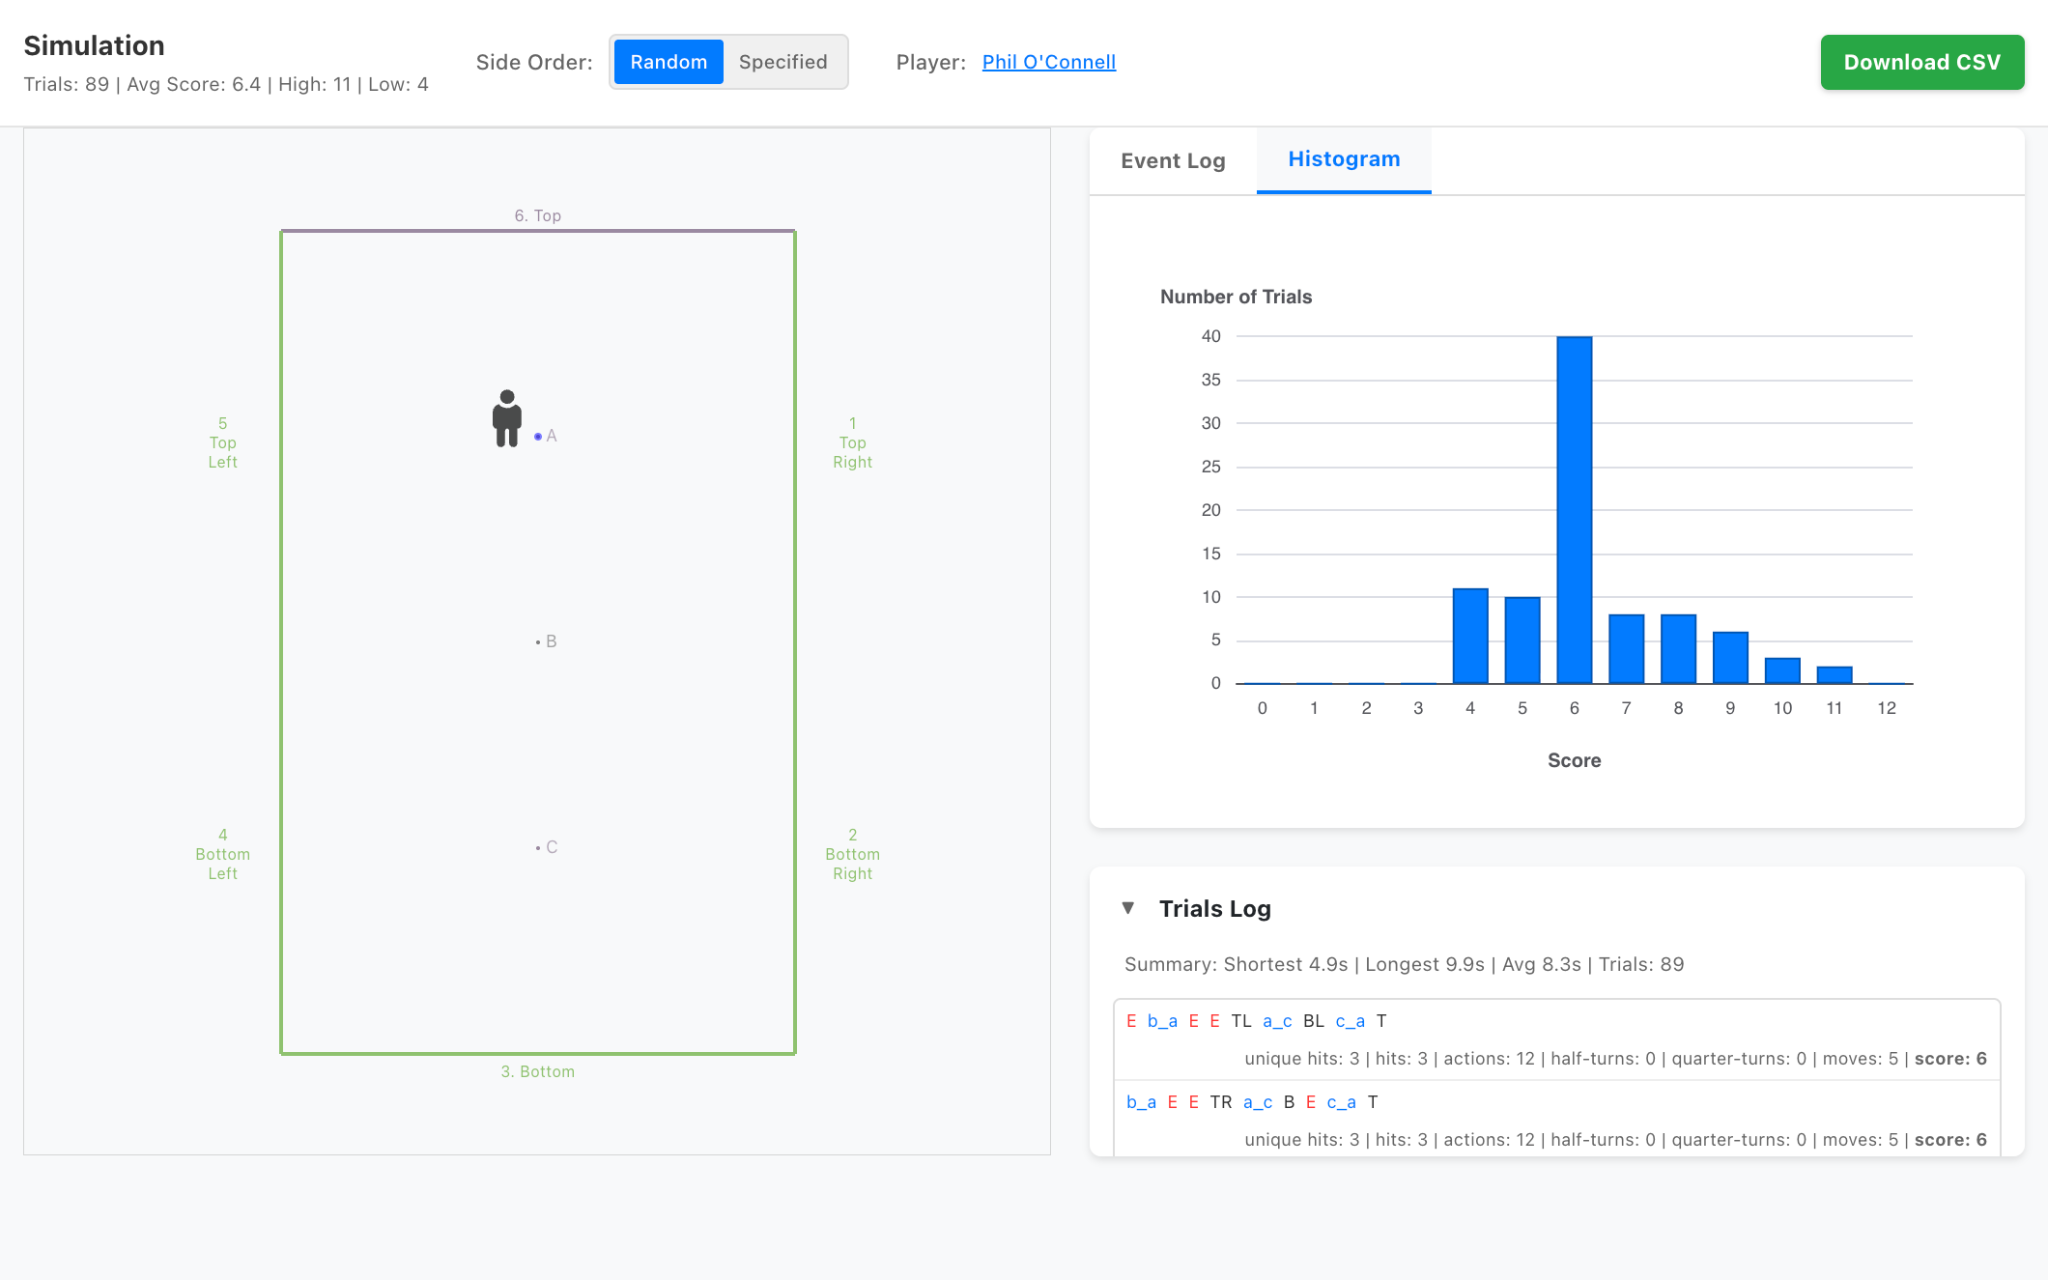
AI Sports Strategy Learning Tool (Prototype)
StrategySim is a protoype for a simulation game for young people who play sport to explore strategy through intuition and AI. Players test tactics in a real-world target challenge, then simulate them repeatedly to see what performs best—making sports data science competitive, tangible, and easy to discuss.
Hi, I'm Peter
I work with software teams, clients and academics across multiple sectors - particularly sport and education - to turn complex data, knowledge and processes into clear, explorable digital tools.
My work combines software engineering and applied AI with learning and human development, grounded in information visualisation, interaction design, the learning sciences and practical experience across education, sport and technology.
Read More →
Hi, I'm Peter
I work with software teams, clients and academics across multiple sectors - particularly sport and education - to turn complex data, knowledge and processes into clear, explorable digital tools.
My work combines software engineering and applied AI with learning and human development, grounded in information visualisation, interaction design, the learning sciences and practical experience across education, sport and technology.
Read More →What People Say
Peter is an experienced and skilled data visualiser and developer, with a strong understanding of data science, data visualisation, sport science and football product development. He worked effectively with Premier League performance professionals, soliciting feedback and shaping feature priorities.
Raf Keustermans
CEO, Sportlight Technology Ltd
Peter’s session was exceptional — one of the most impactful elements of the programme. He designed an AI-driven simulation on statistical decision-making that let students see the immediate effects of tactical choices and data inputs.
Yvonne Comer
Senior Innovation Catalyst, PorterShed
Board member, Irish Rugby Football Union
Board member, Changing Ireland
Board member, Vision Sports Ireland
Peter significantly raised standards in Mathematics, engaging students who were previously making low levels of progress through his ‘Switch Play’ project. He had a positive impact on students’ self-esteem and confidence.”
Clare Verga
Executive Principal, City of London Academy Islington